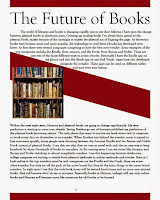
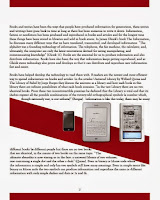
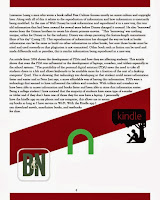
I found it interesting when they said that "90% of the data in the world today has been created in the last two years alone." This data wasn't shocking to me, being in the Digital Technology and Culture program these infographs are something that I'm quite familiar with. Wanting to be a graphic designer I am very familiar with the design aspect of these infographs. "They combine story, data, and design," they make the best and most effective way of getting the information across. These take stories and data and make them easy to read and also in an attention grabbing way. With the online world as it is you must have a great way to grab the attention of the readers, without this your information or story could be overlooked. I know that this works alongside my midterm project which was to write a story/prediction about something that will change in the next eight years. I chose to write a article as if it were part of a technology magazine. The whole point of magazine spreads is to catch the attention of the reader. Most magazines today are 50% ads, which if you are in the print design world is hard to compete with. To compete with ads your article design must stand out like an infograph. Below is an example of my midterm where I designed a magazine spread and wrote an article about my prediction for books and how they will change in the next eight years. I made my design eye catching so that it made you keep reading, and like a magazine I made sure there were visual aspects sp that even if the person looking at the magazine wasn't going to read it, it made them want to continue to flip the pages.


The video below ties the ideas of Big Data together. This helps explain how Big Data is changing out world, I believe there was a quote in the video saying that "the average person processes more data in one day than a person in the 1500's did in their entire lifetime." Seeing that is kind of crazy to think about the fact that we process more data than ever before. I know that growing up in the time of computers I haven't really noticed a huge change in the amount of data that I process but I do know that it has increased the more that social media and other web centered programs become more and more of our daily routines. Personally when I get bored and have nothing to do I tend to just scroll though my Facebook news feed, occasionally I will stop on a persons status update that seems interesting or funny, I will also occasionally open a news article or journal article that catches my attention. I also know that that ties in with the infographs, if something doesn't seem interesting from the picture or the title then I will most likely scroll right past it. In this video I found some of the facts really interesting, especially the part where they go into how bytes themselves are broken up and how much information we store in different amounts of bytes.


